Matt A. Barreto, Ph.D. and Gary M. Segura, Ph.D., Latino Decisions
We get asked the question about “Latino influence” from the press weekly—some weeks, daily. Answering the question is easy if you just make it up, and a fair number of people earn a good living doing so. But our goal has always been to offer electoral analysis rooted in data, that is objective, and verifiable.
In this effort, we offer not a definitive projection about Latino influence in the 2012 but a way to project that influence and the key factors shaping that estimation. With the support of the America’s Voice Education Fund, we develop a framework where we can identify critical values of Democratic or Republican vote shares among Latinos that would effectively deliver a state to the respective candidates. In so doing, we draw on historical vote and turnout data to develop estimates. [ Download slide deck | Watch webinar presentation ]
We begin with three obvious but important premises:
- Presidential elections are won state by state, so any projections in 2012 must be state specific;
- Latino influence in a state is most clearly identified when the Latino margin exceeds the final vote margin—this can occur regardless of the population size—in very close elections, even a small Latino electorate might make the difference, such as Indiana in 2008.
- The likelihood of Latino vote being determinative is dependent on the share of the eventual turnout comprised by Latino voters, the share made up of non-Latino ethnic blocks, and the two-party vote of each.
We cannot know for certain the value of each of those three key measures. Electoral cycles can differ radically, as anyone who compares 2010 with 2006 and 2008 can readily attest. But we aren’t completely at sea, either. We have data regarding vote choice, turnout, and demographic change that can structure our thinking. Moreover, we can make a range of projections rather than a point estimate and still be instructive.
Using the history of two-party vote by group within each state is a start. Using high and low estimates of Democratic (or Republican) support for each group, we can estimate a range of possible outcomes in this regard. Likewise, we can estimate the share of the electorate composed of Latinos and non-Latinos based on the last several elections and population projections for the jurisdiction. Rolling both of those estimates forward will allow us to project the range of possible outcomes and the critical values for Latinos in determining outcomes. As the election season progresses, new and better information regarding the state of play within and across demographic groups will allow us to tweak assumptions and, over the course of time, narrow the range of projections and more clearly identify critical Latino vote shares.
Thinking about the National Electorate
We begin with a national projection as an illustration. The national electorate is illustrated in Figure 1:
 Source: Bowler, Shaun and Gary M. Segura, 2011, ‘The Future is Ours’: Minority Politics, Political Behavior and the Multiracial Era of American Politics. Washington: Congressional Quarterly Press.
Figure 1 starts in 2008 with the outcome between Barack Obama and John McCain. In order to predict a range of possible outcomes, we created two lines. The blue line represents the coalition that propelled Barack Obama to the presidency. For each year, the expected vote total is equal to the projected electorate share for each group times the same two-party vote distribution found in the 2008 exit polls for that group, and then summed across groups. Electorate share is driven by population projections from the Census Bureau. Turnout in each group is held constant at 2008 levels.
While we might have estimated even rosier scenarios for Democrats (for example, assume that Latino turnout grows over time), we erred on the side of caution. The blue line, then, represents a reasonable upper bound on the possible Democratic vote share.
The red line represents the coalition that propelled the massive GOP gains in 2010. For each year, the expected vote total is equal to the projected electorate share for each group times the same two-party vote distribution found in the 2010 House exit polls for that group, and then summed across groups. Turnout in each group is held constant at 2010 levels. Again, we might have assumed even better outcomes for the GOP, but their smashing success in 2010 seems like a reasonable lower bound for Democratic vote share in future elections.
The purple line in the center is the mean of the lower and upper bounds.[1] As is plain, the GOP faces an increasingly difficult socio-demographic reality. Even if they hold the 60% share of the non-Hispanic white vote and hold Democratic performance among Latinos to just 60%, the lights go out for them by 2036. More realistically, things get tough very soon. Merely splitting the difference between the good Democratic year of 2008 and the good Republican year of 2010 yields Democratic majorities from this point forward.
Most importantly, in 2012, if Republicans hold their white, Asian and “other” shares at their highly successful 2010 levels, Latinos and African Americans alone could still give Democrats a 50.3% share of the national popular vote if they simply vote just as they did in 2008.
Again, we are able to project these ranges based on some relatively simple assumptions regarding turnout, population growth, and vote choice. Importantly, they are assumptions, but generally reasonable with respect to likely electoral swings.
State-level Projections
As we mentioned, of course, presidential elections are not won by popular vote and the real action—and the place where the Latino vote is more likely to shape outcomes—is in the individual states. In this first round of estimations, we have focused on 16 states where Latinos could significantly influence who wins a statewide election. Certainly other possibilities exist, and some may argue that states such as New York or Texas are not that competitive, but we caution the reader to not take too narrow of a view of competitiveness of the presidential candidates. In each of the states here, there are many examples of close elections for statewide office, and we offer one example for each state, though many more abound.

Each of the states was selected because it was critical on at least one of four key dimensions: (1) the presidential election will be close, that is, the state is perceived to be a “battleground;” (2) the state has an interesting or important U.S. Senate, gubernatorial or other statewide election of interest, including important ballot initiatives; (3) the Latino electorate is large; or (4) the state has an emerging and potentially decisive Latino electorate in a part of the country where Latinos are not generally understood to be electorally important.
In the next several sections, we will walk through each state’s electoral circumstances and illustrate graphically, conditions under which the Latino vote can be decisive. In forecasting where and when Latinos may be influential there are three key variables to take into consideration, all of which may fluctuate on election day. These variables are: (1) what percentage of the electorate is Latino; (2) the Dem-Rep partisan vote among non-Latinos; (3) the Dem-Rep partisan vote among Latinos. Ideally, analysts would be able to take into account, in real time, the best estimates for each of the above three variables and adjust their expectations and models accordingly. In coming weeks we will unveil a dynamic tool for users to change estimates and see how the outcomes also change. Because the election is still 7 months away, we used fixed values for the above three variables for now, but fully expect these could change as election day approaches and voter sentiment changes.
The key question that journalists, election pundits and campaign consultants have been asking is what percent of the Latino vote Mitt Romney needs to win to be competitive. In 2004 when George W. Bush was re-elected most data suggested he was able to increase his vote share among Latinos, perhaps to as high as 40%. In 2008, Republican John McCain won an estimated 31% of the Latino vote nationally and states such as New Mexico, Colorado, Nevada and Florida all swung Democrat. All four of these states with a notable Latino population voted Republican in 2004, and with a larger Latino electorate in 2008, and one that voted more heavily Democratic, all four states flipped from Bush to Obama in 2008. While the 40% Republican vote figure that is often cited by followers of Latino politics is certainly credible, it is a national benchmark that fails to take into account the intricacies of each state.
Here, we present one effort to account for the differences in the Latino and non-Latino population in a variety of states to determine at what point, the Latino vote can single-handedly cause a state to flip from Republican to Democrat – or vice versa – from Democrat to Republican. As we note above, in doing this we estimate the percentage of all votes that will be cast by Latinos, as well as take into the historical range of the two-party vote won by Republicans among non-Latinos, and then provide a sliding scale of the potential two-party vote among Latinos. Note that non-Latinos include Whites, Blacks, Asian Americans and any other non-Hispanic groups. While the White vote is often more heavily Republican, when Blacks and Asians are included, the non-Latino vote, while still Republican leaning, is typically in the range of 51-55% Republican, depending on the state.
In each graph, we start by fixing the share of all voters who are Latino, based on historical Latino turnout patterns, growth projections, and 2010 census data on the number of eligible Latino voters in each state. Given that Latinos will represent a fixed percentage of all voters – say 11% in a state like Colorado – we can predict whether the state will vote Republican or Democrat, if we have a good guess on how non-Latinos are leaning (which we will know from the aggregate of pre-election polls) and how Latinos are leaning (which we will know from Latino Decisions pre-election polls). Keep in mind, we fully expect our models of Latino influence to vary over summer and fall 2012 as polling data on Latinos and non-Latinos comes into sharper focus, or shifts. The model we offer here is adaptable and over the course of the 2012 election we will continually update our projections.
Consider the Colorado example in the graph below. If Latinos account for 11% of all votes cast on election, and we set the non-Latino vote in Colorado at 52% Republican, represented by the solid black diagonal line, we can estimate the overall Republican vote won based on different possible outcomes among Latinos. For example, if Latinos were to vote 0% Republican, and non-Latinos voted 52% Republican, the overall outcome would be 46.3% of the vote going to the Republican, which is the starting point on the far left hand side of the graph for the solid black line. Each grey starred-line represents one additional point higher or lower in Republican vote share among non-Latinos. So if non-Latinos voted 53% Republican we should follow the grey starred-line above the solid black, and if they voted 51% Republican we can follow the grey stars one row below the solid black line. Returning again to the solid black line, we are most interested in where this crosses the 50% threshold represented by the purple line in the middle of the graph. Of course, all outcomes above 50% indicate that the Republican candidate would win the state. In this specific instance, the Colorado data tell us that if the Republican candidate wins 36% of the Latino vote, and 52% of the non-Latino vote, they would win the state. If they can do 1 percent better among non-Latinos, and carry 53% of the non-Latino vote, the grey starred-line just above indicates they would need 29% of the Latino vote to surpass 50% statewide. And on the other end, if the non-Latino vote is very, very close, and the Republican carries just 51% of non-Latinos, he or she would need to win almost 44% of the Latino vote to win the state of Colorado.
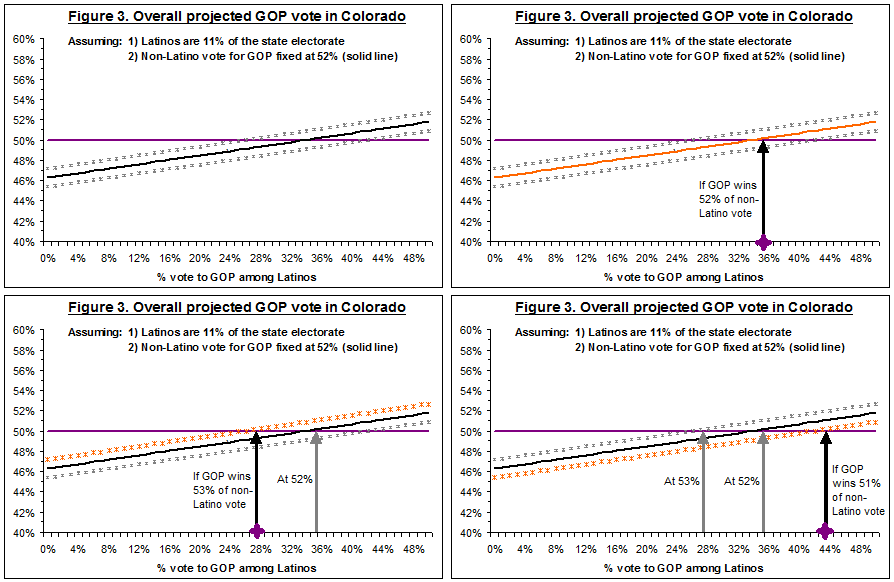
In addition the non-Latino and Latino GOP vote shares varying, the percent of all voters who are Latino on election day may be higher or lower than 11%. If the Latino vote is 12% of all voters in Colorado then the Republican candidate would need to win even more Latino votes than the 36% estimate above, in fact they would likely need 37% of the Latino vote, given 52% of the non-Latino vote. These additional simulations are easy to project with a few calculations, and in coming weeks, we will release an online tool for users to set these various parameters themselves.
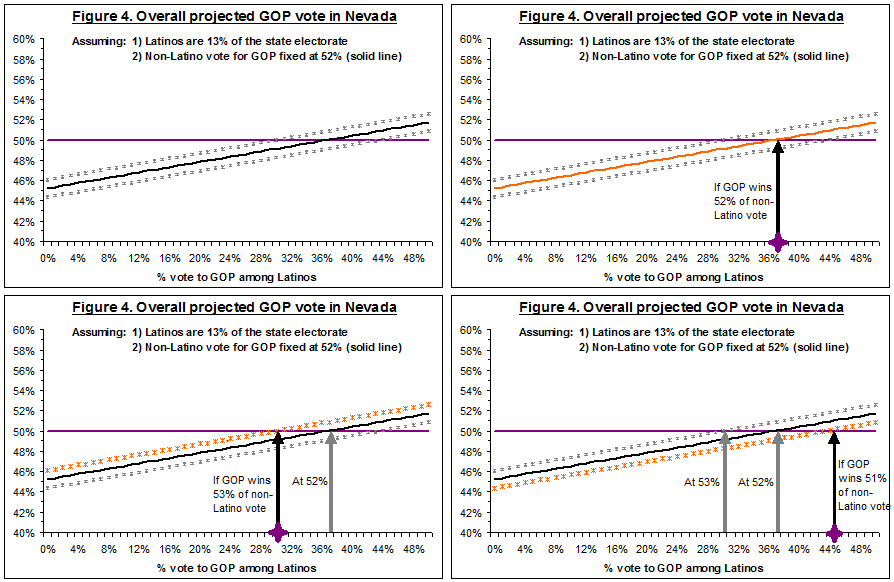
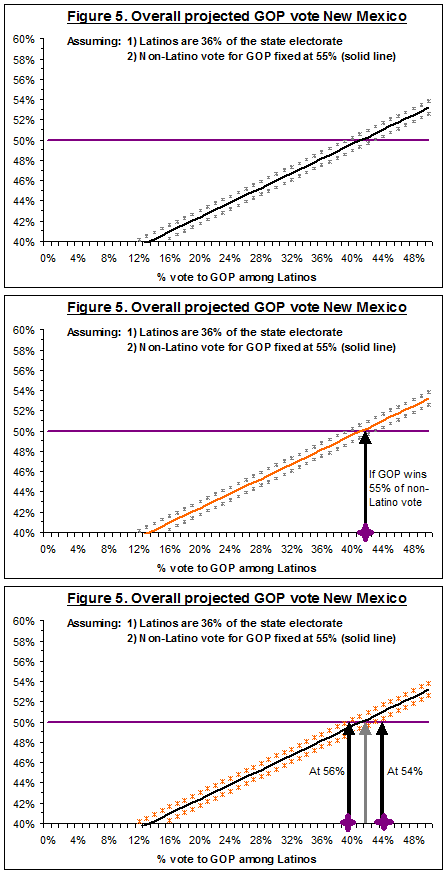
Moving to other states, we can continue to estimate the percent of the Latino vote necessary for a Republican candidate to carry, to win the state. For example, in Nevada where Latinos are slightly more of the electorate at 13%, a Republican would need to win 37% of the Latino vote, and 52% of the non-Latino vote in order to win statewide. In a state such as New Mexico with a very large Latino population, estimated to be 36% of all voters, a Republican candidate needs to win 42% of the Latino vote to win, assuming they do well and win as high as 55% among non-Latinos, which historically had been the case.
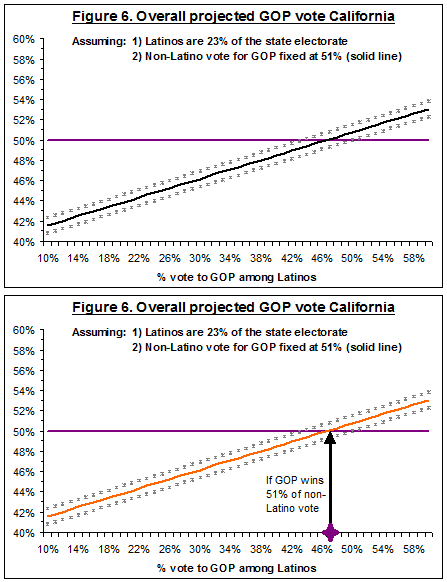
If a state’s non-Latinos are evenly divided, or perhaps just barely lean Republican such as in California, the Latino vote is all the more important. While California often looks favorable to Democratic candidates from a distance, upon closer inspection this Democratic edge has rested almost entirely in the hands of Latino voters in recent years. If a Republican secures 51% of the combined non-Latino vote in California, they would need to win 47% of the Latino vote to win statewide. If they can do better among non-Latinos, and win perhaps 53% there, they would still need 40% among Latinos to win statewide. Because Latinos trended heavily Democrat in 2010 in California, what was actually a very close election among all non-Latinos resulted in safe wins for Jerry Brown and Barbara Boxer. In contrast when Arnold Schwarzenegger was re-elected in 2006 he won an estimated 39% of the Latino vote.
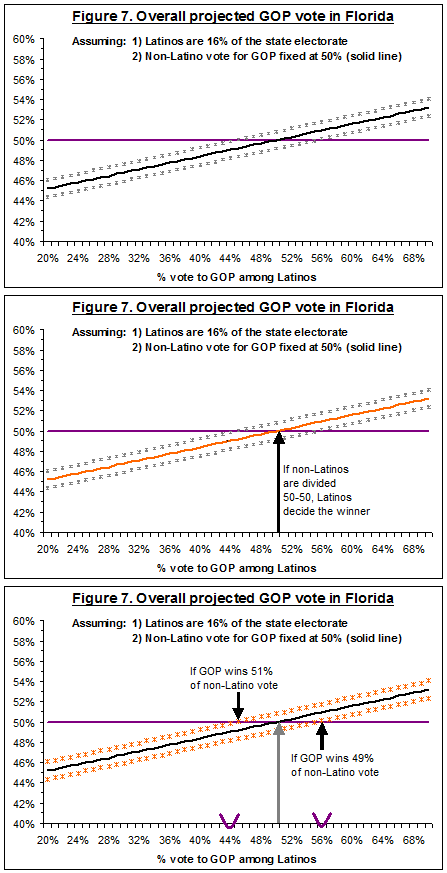
In some states like Florida, where the non-Latino vote seemingly rests squarely at a 50-50 distribution, the Latino vote is extremely influential at an estimated 16% of the electorate. Unlike other states, the Latino vote in Florida is much more divided and has demonstrated swings in different elections. While Bush won an estimated 56% of the Latino vote in Florida in 2004 on his way to victory, Obama carried 57% of Latinos in 2008 in winning the state, and in 2010 Marco Rubio won 62% among Latinos. Looking to our model, when a Republican candidate wins 51% of the non-Latino vote in Florida, they would need to win 45% of the Latino vote to win statewide. However, if they fall under 50% and win 49% of the non-Latino vote, they can still win Florida if they win 56% among Latinos. Historically the Latino vote has been the deciding factor in Florida elections. In 2004 when Mel Martinez was elected to the U.S. Senate he lost among non-Latinos, but his 60% vote share among Latinos gave him an overall win by 1 percent.
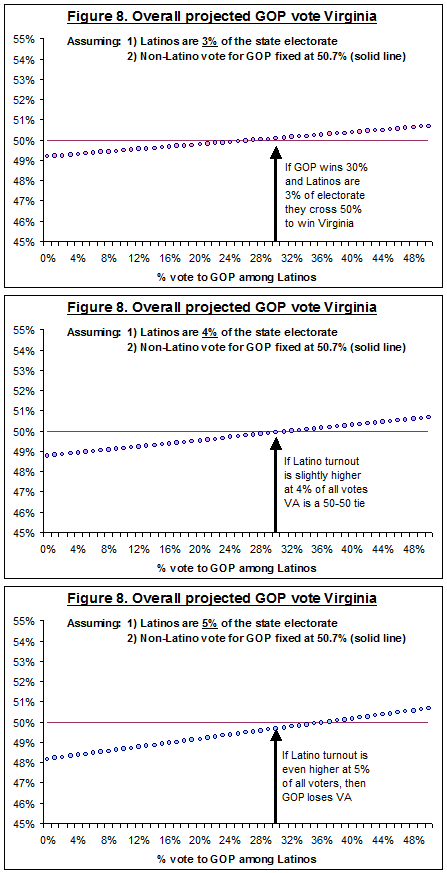
Elsewhere, where the Latino vote is smaller, it still has the potential to be influential if the election is close, as was the case in states like Indiana and North Carolina in 2008. In 2012 states such as Virginia, Pennsylvania, Washington, and North Carolina all promise to have very close elections for President, Governor, U.S. Senate. If the non-Latino vote leans Republican by the slightest margin, say 50.5% then they would need to win at least 35% of the Latino vote when Latinos are 3% of the electorate. If Latinos are 4% of the electorate the Republican needs to win 39% among Latinos to win statewide, and when Latinos are 5% of the electorate in a close state the Republican must win 41% among Latinos to win. Examining this from the Democratic perspective, Latino turnout will be crucial in these states where Latino voters are just 3-5%. If the President does well and wins 70% of the Latino vote, he can lose the non-Latino vote 49.3% to 50.7%, and still win statewide when Latinos are 5% of the electorate. However if Latinos are just 3% of the electorate in the same scenario, even if the President wins 70% of the Latino vote he would lose the state. Thus, even beyond the obvious states like New Mexico and Florida, the Latino vote can still prove very influential in less obvious states because the non-Latino vote is so evenly divided, and the Latino voting eligible population has been growing rapidly over the past decade.
To watch the webinar, click play:
[wpvideo UxLkKZqE]
[1] Greater detail regarding the development of this model is found in Bowler and Segura (2011).

