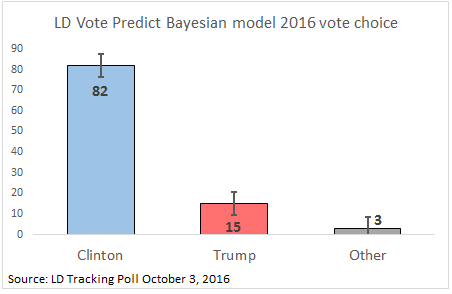
LD Vote Predict: 82% Clinton, 15% Trump, 3% other candidates (+/– 5.5%)
In 2012 we unveiled our statistical model predicting election day vote called LD Vote Predict, which proved to be extremely accurate. Using the same hierarchical Bayesian model we now turn to our 2016 tracking poll to estimate election day vote choice for Clinton v. Trump.
Records on Latino voting preferences in presidential contests stretch back at least nine elections, to Reagan’s 1980 victory over Jimmy Carter. Over the past three-and-a-half decades, Bill Clinton’s reelection in 1996 with 72% of Latino voters vs. Bob Dole’s 21%—a fifty-one point gap—has been the most lopsided outcome recorded. According to our current projections, using LD Vote Predict—Latino Decisions’ survey-based simulation model—we expect to see this record fall next month, as Latino voters cast votes overwhelmingly for Democratic nominee Hillary Clinton.
Based on the most recent round of our tracking poll, conducted over the past three weeks with the National Association of Latino Elected Officials Education Fund and Telemundo Noticias, we predict that just 15% of Latino voters will vote for Republican Donald Trump on Election Day. We are highly confident that—barring any major unforeseen change—Trump’s Latino vote will fall between 9.5% and 20.5%. Furthermore, support for third party candidates seems to be lagging behind the electorate at large this election season, making it extremely likely that we will see Clinton’s share of the Latino vote surpass the 71% Obama earned in 2012 and the 72% Bill Clinton earned in 1996. Today, our model estimates 82% vote for Clinton and we are highly confident that it will be somewhere between 76.5% and 87.5%.

More information on the modeling strategy of LD Vote Predict can be found in our original posts (e.g. Introducing LD Vote Predict) from when Latino Decisions piloted it four years ago. In 2012, we developed LD Vote Predict in order to forecast the proportion of Latino voters that were likely to vote for candidates Mitt Romney and Barack Obama that November. We based our modeling approach on what we had learned from the 2010 Congressional elections about the relationship between what survey respondents tell us of their partisanship, their candidate preferences, and their openness to changing their minds—on one hand—and their actual behavior on Election Day.
For the 2012 presidential election modeling process, we had to use results from our 2010 Congressional election and post-election surveys to draw inferences about the relationship between survey responses and voter behavior in a presidential election. Needless to say, this apples-to-oranges comparison was less than ideal, but we managed to do quite well in forecasting the eventual outcome; see LD Vote Predict 2012 Final Forecast. This year, we have the benefit of learning from the 2012 Latino Decisions/impreMedia presidential tracking poll and post-election survey, and can apply the lessons learned to the current presidential forecast. While we do not assume these two elections to be similar, in terms of expected turnout or vote choice, we do work on the assumption that survey responses predict behavior in the same manner across election cycles. Thus, voters providing identical answers to survey questions on their party identification, intention to vote, and candidate preference in 2012 and 2016 are assumed to exhibit the same probabilities of voting behavior in each year.
In the coming weeks leading up to the election, Latino Decisions will update our predictions as additional waves of the tracking poll become available. We will also look more closely at voter enthusiasm using LD Turnout Predict and discuss how these two components of civic decision-making (turnout and vote choice) relate to group electoral influence.
Notes on Methodology
The basic approach of LD Vote Predict has been described in previous posts. The weekly projections and measures of uncertainty are based on a hierarchical Bayesian model of turnout and vote choice. The relationship between survey responses/previous voting behavior and actual likelihood that a respondent will vote is estimated from previous polling data and validated voting records. Likewise, the probability that an individual will vote for one candidate over the other is based on their stated intention (e.g., solid Clinton or Trump, leaning Clinton or Trump, or undecided) as well as other variables that have been demonstrated to be highly predictive of vote choice. The relationship between these predictors and actual vote, (assuming a person indeed casts a vote) has been estimated from previous polling data and follow-up calls after the election. So instead of restricting our attention to only “likely voters” and those who have already decided for whom to vote, we consider the responses of registered Latino voters, and estimate whether they will vote and if so, for whom. Furthermore, we allow for differences in voting patterns among those of different levels of commitment and enthusiasm for their favored candidate.
While past elections teach us about how to use respondents’ answers to project their turnout and vote, it is important to note, that we do not assume turnout patterns will closely track previous elections.
Justin H. Gross is Chief Statistician at Latino Decisions and Assistant Professor of Political Science at UMass-Amherst. Justin holds a Ph.D. in Statistics and Public Policy from Carnegie Mellon University. His applied research interests are in public opinion, Latino politics, political communication, and public policy. He works on methodological problems in measurement, text analysis, and network analysis, and is especially interested in methods that put statistical and computational tools to use in service of our ability to achieve rich qualitative insights.

