David F. Damore, University of Nevada, Las Vegas
What a difference a decade makes. In 2001, despite constituting 20% of Nevada’s population, Latinos received little to no consideration in the state’s redistricting process.[i] In 2011, representation of the state’s Latino community – now over 26% of Nevada’s population – was the main point of contention that caused Nevada’s reapportionment and redistricting to be completed in state court.[ii] Throughout redistricting negotiations, Republicans cited the lack of a majority-minority Latino U.S. House district (Nevada was awarded its fourth House seat after the 2010 census) as grounds to oppose maps proposed by the majority Democrats. Ultimately, because Republican Governor Brian Sandoval’s vetoed two sets of maps passed on party line votes and refused to call a special session to complete Nevada’s redistricting, Carson City District Judge Todd Russell took control of the process and appointed three special masters to complete Nevada’s 2011 redistricting.
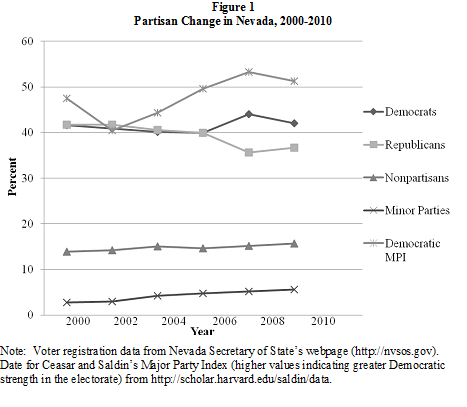
Cynics accused the Republicans of using Latino representation as a fig-leaf for broader fears about the political implications of Nevada’s changing demographics. Between 2000 and 2010, Nevada was the nation’s fastest growing state and is now one of the most urbanized and diverse states in the country – two important drivers of the Democratic vote in the Mountain West. Specifically, nearly three out of four Nevadan’s reside in Clark County (Las Vegas) and the state’s minority population increased by10% with better than 45% of all Nevadans being classified as non-white by the 2010 U.S. Census. Aided by a heavy investment in resources and political talent by Reid Inc. (the moniker of the U.S. Senate Majority Leader’s extensive political organization), Nevada Democrats took advantage of these demographic trends to flip the state from Republican leaning to Democratic leaning by decade’s end. Figure 1, which summaries Democratic electoral strength using Ceaser and Saldin’s Major Party Index and voter registration figures between 2000 and 2010, captures the Democratic rise in Nevada during the prior decade.[iii]
Thus, regardless of the final contours of the maps, changes to the state’s political demography meant that the 2011 redistricting would favor the Democrats. Instead of accepting this reality, Nevada Republicans clung to a tortured interpretation of Section 2 of the Voting Rights Act in hopes of extracting a more favorable outcome. Specifically, by claiming that Nevada was required to draw one of its House seats as majority Latino, Republicans were at odds with the Shaw v. Reno (509 U.S. 630 ) holding, which allows race to be considered but not the primary factor (as the Republican proposed House map did) in drawing district boundaries. Moreover, as Democrats and many allied Latinos noted, packing Latinos into a single U.S. House district would marginalize Latino influence in Nevada’s other three U.S. House districts and because white voters in Nevada do not vote as a block to deny Latinos representation of their preferred candidates as evidenced by the fact that Latino candidates won a number of state legislative seats, the attorney generalship, and the governorship in 2010 without such accommodations, race-based redistricting in Nevada is unnecessary.
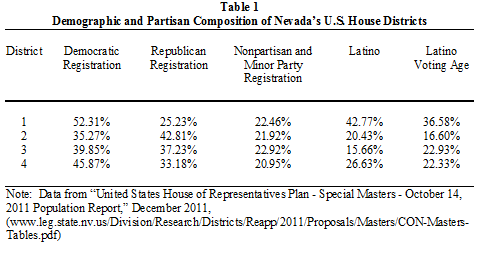
By forcing redistricting into the courts, Nevada Republicans miscalculated and ended up with a less favorable outcome than if they had accepted either of the Democratic plans passed during the legislative session. To be sure, regardless of who drew the maps, the manner in which Nevada’s population is distributed ensured that the outcome for Nevada’s four U.S. House districts would be two safe Democratic seats, one Republican leaning district, and one swing district. However, in realizing this outcome, the special masters opted not to create a majority Latino House district. Still, as indicated by the data presented in Table 1, which summarizes the demographic and partisan composition of Nevada’s four U.S. House districts, Latinos constitute 43% of Nevada’s 1st House District and Latinos of voting age are nearly 37% of the district’s population. Moreover, except for the Republican leaning district (Nevada’s 2nd), the Latino population is larger than the Latino voting age population in the other three U.S. House districts suggesting that the demographic transformation of Nevada’s electorate will continue in the coming decade. Given the extensive mobilization of Nevada’s Latino community by the Democrats since 2004, these trends are particularly troubling for Nevada Republicans who only in the last month hired a Latino outreach coordinator.
Equally problematic for Nevada Republicans are the special masters’ state legislative maps. Because of growth patterns during the prior decade, southern Nevada was assured of gaining a state senate seat and two assembly seats (48 of 63 seats in the Nevada Legislature are now located in southern Nevada). Thus, the main issue was which seats would be moved from northern Nevada to the Democratic stronghold of Clark County. In both of their plans the Democrats proposed moving seats located in and around Washoe County (Reno) to southern Nevada and preserving two stand alone rural state senate districts. Instead, the special masters created one stand alone rural senate district and moved the other rural state senate seat to southern Nevada. Moreover, the senate seat in Washoe County that the Democrats had originally proposed to move south was drawn with a Republican registration advantage of less than 1%.
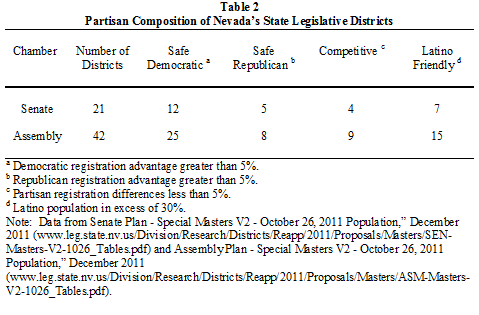
More generally, as the data in Table 2 suggest, for Nevada Republicans to gain the majority in either chamber of the Nevada Legislature in the coming decade will require that Republican candidates consistently win an overwhelming share of the nonpartisan vote (16% of the electorate). In the state senate, 12 seats have a Democratic voter registration advantage in excess of 5% as compared to only five such seats for the GOP. And in only one of the four competitive senate district do Republicans have a registration advantage greater than 1%. The GOP’s prospects are even less favorable in the Assembly where the Democrats now have 25 seats with registration advantages in excess of 5%. In contrast, there are only eight seats that favor the Republicans and nine seats where neither party enjoys a registration advantage greater than 5% Lastly, Latinos should be able to continue to increase their ranks in the Nevada Legislature in the coming decade from their present eight given that over a third of all state legislative districts have Latino populations in excess of 30%.
[ii] Population and demographic data cited here come from the U.S. Census Bureau, “State and County Quick Facts,” August 2011 (http://quickfacts.census.gov/qfd/index.html) and U.S. Census, “American Fact Finder,” August 2011 (http://factfinder2.census.gov/faces/nav/jsf/pages/index.xhtml).
[iii] The Major Party Index combines a party’s electoral support in the most recent presidential, gubernatorial, U.S. Senate, and U.S. House contests and the share of the seats that the party controls in both chambers of the state legislature; see, James W. Ceaser and Robert P. Saldin, “A New Measure of Party Strength,” Political Research Quarterly (June 2005): 245–56.
David F. Damore is an Associate Professor of Political Science at the University of Nevada, Las Vegas and an expert in Nevada politics.


