Latino Decisions interview 1,870 Latino registered voters nationwide across 13 weeks, beginning August 9 and ending on October 28. In the weeks after the election, we attempted to re-contact those registered voters from November 3 – 19, 2010 to ask whether, why, and for whom they voted. Of the original 1,870, we were able to successfully re-contact 1,078. Of those we successfully re-contacted, 79.2% report having actually voted in the November election, with 71% stating they voted Democrat and 29% Republican. (Our sample of those reporting to vote is 854, +/- 3.3%)
The re-contact panel design of these data allow us to explore several important aspects of the tracking poll and the behavior of the Latino electorate. Specifically, these data allow us to:
• Estimate the self-reported turnout of voters after the election compared with their reported intentions with respect to voting at the time of the original interview;
• Examine the manner of voting most often preferred, between early/absentee and polling place voting;
• Gauge the stability of preferences by comparing intended two-party vote from the pre-election poll, with their post-election vote report, and
• Determine how those reportedly undecided in the pre-election interview ultimately voted – Democrat, Republican or Abstain.
How Seriously Can We Take Intention to Vote (A First Look)
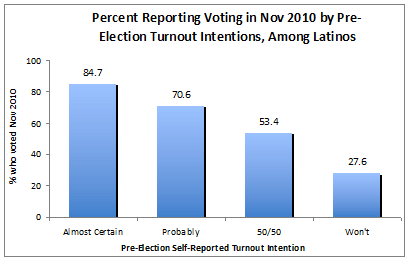
Since the data are not fully validated for official turnout (stay tuned), at this point we can only compare the turnout self-reports to the pre-election intention. Among those who described themselves as “almost certain” to vote in the pre-election interview, approximately 85% report actually casting a ballot. The comparable number was 71% of those saying “probably.” True to their words, 53% of those saying the chances were “50/50” report having cast a ballot.

Two preliminary lessons can be drawn from these data, pending the final validation of turnout. First, respondents were consistent in their reporting and, quite possibly, honest in their pre-election evaluation of vote possibilities. Less than 28% of those planning not to vote go on to report casting a ballot. Those “almost certain” to vote, almost certainly did.
Second, the enthusiasm gap, in the end, may have been less significant than was anticipated. Over 70% of those saying they would only “probably vote” did. Even in the weaker (50/50 and Not) categories, self-reported turnout exceeded even the respondent’s pre-election estimation of their own behavior. A final conclusion with respect to enthusiasm and turnout will have to wait until the validation is complete, but these numbers suggest both that our pre-election measure was generally accurate and that turnout was higher than the pre-election polls may have suggested.
How did Latinos Cast their Ballots? Early, Absentee, Polling Place?
Our post election re-contact survey asked whether respondents used early voting stations, cast a ballot absentee, or went to the polls. Not surprisingly, over 60% of those reporting having voted did so in a traditional precinct polling station. Still, as surprising 22% reported using early voting while another 17% voted absentee. These rates vary considerably by state, as you would expect given the differences in state laws with respect to available methods of voting.
Most interesting is how method of voting is related to the two-party vote. Those voting in traditional precincts were significantly more Democratic (75.4%) than those voting early (67.1%) or absentee or by mail (61.0%). While these data, too, require validation, this pattern could have significant implications for mobilization strategies of candidates and parties. This also suggests the Democratic party was stronger in election day get-out-the-vote mobilization where their vote share was 8-13 points higher than early and absentee voters.
Stability of Preferences and the Break of the “Undecideds”
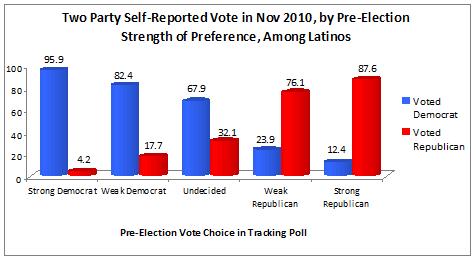
How stable were candidate preference? That is, did respondents with a pre-election commitment to Democratic or Republican candidates act on them? Overwhelmingly, voters behaved consistent with their pre-election preferences. Among those voting and reporting a preference, almost 96% of voters who had expressed a pre-election support for Democrats voted this way, while almost 88% of those with a strong-GOP preference voted for the Republicans. This is no surprise. Those two categories are also less likely to report not having voted at all, or refusing to disclose their vote (which, in a post-election survey, is often suspicious and potentially an indicator of non-voting).

By contrast, only 82% of those offering weak support for the Democrats went on to vote that way, 76% of those weakly favoring Republicans. These two categories were also prone to significant fall-off—that is, weak preferences were more likely to result in not voting at all or refusing to disclose their vote.
And what of the undecideds? For those voting and reporting, the undecideds split 2-1 in favor of the Democrats. Almost 68% of undecided voters from the pre-election waves who say they voted went on to Democrat. But undecided voters were far less likely to be in the voting and reporting category. In fact, of the original sample, 30% of the undecideds report NOT having voted in November. This pattern is perfectly consistent with previous research on political behavior that finds that those slow to decide often fail to vote at all.
Latino Two-Party Vote in 2010
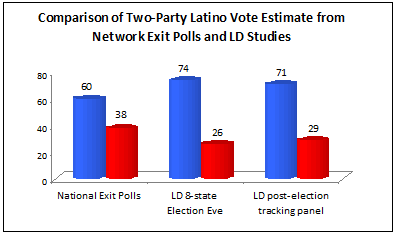
Finally, we at Latino Decisions have had a great deal to say about the two-party vote, and estimates coming from the exit polls. Those polls, somewhat unbelievably, estimate a 60-38 two-party split favoring the Democrats. In our election eve poll, asked only of extremely high propensity voters and those reporting already having cast a ballot, our estimate for the eight states we sampled was 74-26. What did the tracking poll show?
Among tracking poll respondents we re-contacted, the two-party split was 71-29 Democratic. Confining the analysis to only those who had voted in the last three elections (roughly akin to our screener in the election eve poll) yields almost the same result, at 72-28. These numbers are only slightly less Democratic than our election eve poll and, consistent with the final release of the pre-election tracking poll, and most notably, a far cry from the exit polls used by the television networks. In the coming weeks and months we’ll be returning to the exit polls and their flaws with more insight.


