By Rene Rocha, University of Iowa
What determines public opinion on immigration policy has been the subject of much debate. Among the most regularly cited explanations are a series of individual characteristics such as ideology, age, gender, education, and economic vulnerability. However, some social scientists have also hypothesized that the racial/ethnic residential environment of individuals plays a key role in determining racial/ethnic attitudes and policy preferences. The focus of this blog report is to explore the relationship between community diversity and immigration attitudes.
A New Approach to the Role of Residential Context
The link between residential context and public opinion can best be explained through social identity theory, which essentially argues that people are psychologically hard-wired to automatically sort the world into “in-groups” and “out-groups.” Since race is a salient physical characteristic, the formation of strong in-group/out-group distinctions based on racial differences is relatively effortless and therefore very common.
This general argument has given rise to many more specific hypothesis, including the “power-threat” or “racial threat” hypothesis. In its simplest form, the hypothesis suggests that as the size of a racial minority group in an area increases, majority group members will feel threatened and respond by engaging in punishing behavior, such as lowering or withdrawing support for pro-minority public policies. This idea is, in fact, quite old by academic standards. Political scientist V.O. Key noted in 1949 that counties with substantial African American populations were also the ones in which conservative gubernatorial candidates enjoyed the most support. Numerous studies over the past 60 years lend support for this argument.
Still, other social scientists have made the opposite claim. They argue that larger minority populations increase interracial contact and make it difficult for groups to accept typically negative racial stereotypes. This is typically referred to as the “social contact” hypothesis. The social contact argument has led some scholars to suggest that non-Hispanic whites are more likely to develop favorable attitudes toward minorities in areas where minorities make up a large proportion of the population. With regular contact, an out-group eventually comes to be considered part of the in-group, punishing behavior toward minorities is eventually replaced with rewarding behavior, thereby increasing support for public policies that stand to benefit minority group members.
Previous work does not offer unconditional support for either hypothesis, but suggests the presence of another interesting dimension to this debate. It may be that non-Hispanic whites react to the presence of certain segments of the Latino population, such as foreign and native born individuals, differently. In this study, we looked for continued evidence of this claim. Is it the case the non-Hispanic whites react positively or negatively to the presence of Latinos in their communities? If they do react, do these reactions differ depending on the whether the Latino population is primarily foreign born or native born?
We also wanted to move beyond an exclusive focus on the opinions of non-Hispanic whites and study how Latino attitudes vary by community context. The little work that has been done on this topic suggests that Latinos tend react to the presence of immigrants in a manner similar to non-Hispanic whites. This finding, however, is somewhat at odds with studies of how African Americans respond to living in heavily segregated environments. Those works find that African Americans’ sense of racial identity and support of racial liberalism increases when living in largely African American neighborhoods. Assuming that this is also true for Latinos, living in an area with a large Latino population might generate liberal policy preferences regarding immigration.
Research Design and Findings
To answer these questions, my coauthors and I relied on a public opinion survey conducted by the Survey Research Center at Texas Tech University. This survey was in the field during the summer of 2006 and sampled respondents living in Texas and purposefully oversampled Latinos. Both studies used the same instrument and the Spanish translations for those conducted in Spanish were done by native Spanish speakers. Latinos comprised 45% of our final sample (252 respondents), while non-Hispanic whites comprised 55% of all respondents (362 respondents).
Respondents were asked for the positions on the following statements regarding immigration:
1) Do illegal immigrants help or hurt the U. S. economy? (Help the economy by providing low-cost labor, Hurt the economy by driving wages down)
2) Should the number of new legal immigrants be increased or decreased? (Increased a lot, Increased a little, Neither increased or decreased, Decreased a Little, Decreased a Lot)
3) Do you agree or disagree with the building of a fence along the U.S.-Mexico border? (Strongly Agree, Agree, Neither Agree or Disagree, Disagree, Strongly Disagree)
In our analysis, we tested to see whether the percentage of Latinos (total native-born and foreign-born) within each respondent’s county influenced their policy views, controlling for individual features such as education, income, sex, and partisan identification. The percentage of Latinos in a respondent’s county proved to be a powerful predictor of their opinions and, interestingly, most of the individual characteristics failed to consistently predict attitudes on immigration. In fact, no single individual characteristics successfully predicted opinions across the three questions in the survey.
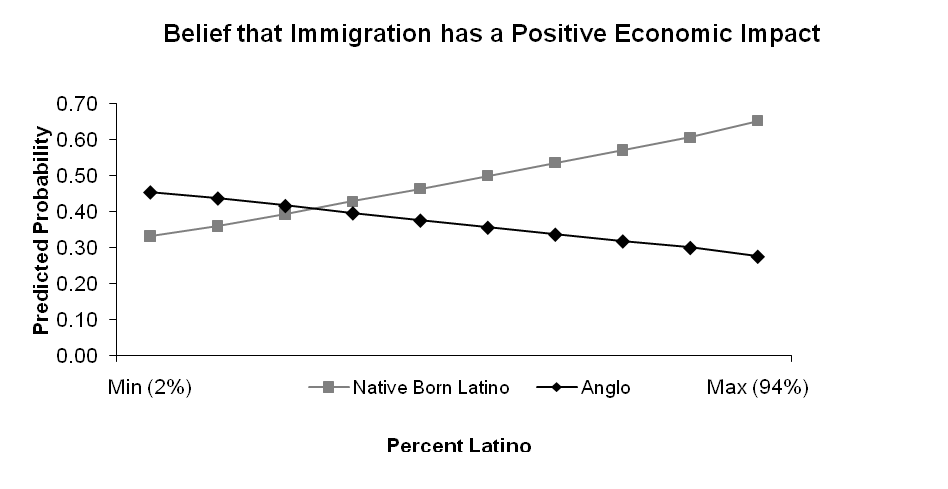
Our findings showed that non-Hispanic whites residing in areas with a large Latino population are more likely to develop restrictionist attitudes, while Latinos residing in contexts with a large Latino population are more likely to develop liberal feelings toward immigration.
For example, the probability that a non-Hispanic white living in an area with few Latinos (2% of the population, the lowest seen in any county in Texas) agrees with the idea that immigration has positive economic consequences was relatively high (45% chance). A non-Hispanic white residing in a predominately Latino area (94% of the population, the highest seen in any county in Texas) is much less likely to hold this belief (there was 27% chance of agreement). The opposite is true for Latinos. Latinos residing in areas where few other Latinos live (2%) are less likely to believe that immigration has positive economic consequences than those who live in heavily Latino areas. Unlike non-Hispanic whites, native-born Latinos respond positively to the presence of Latinos and tend to view immigration favorably in heavily Latinos areas. The figure below illustrates this trend.
Our subsequent analysis revealed that this trend holds when looking exclusively at the size of the native-born Latino population. In other words, non-Hispanic whites are reacting to all Latinos, not just the presence of foreign- born Latinos. This suggests a clear ethnic dimension surrounding immigration policy in Texas and possibly nation-wide as well.
Those in favor of more “hard-line” immigration approaches often cite the importance of following proper immigration procedures as well as national security concerns, while eschewing the suggestion that these attitudes are motivated by culturally nativist or ethnic-based factors. These results, however, demonstrate that anti-immigration sentiment is largely a product of the size of the Latino population in one’s community, including the native-born segment. We conclude, therefore, that racial or ethnic based concerns may trump worries about legal procedures or national security when it comes to the formation of immigration policy attitudes.
Rene Rocha is an Assistant Professor at the University of Iowa
Full Citation for the Study: Rocha, Rene R., Thomas Longoria, Robert D. Wrinkle, Benjamin R. Knoll, J.L. Polinard, and James P. Wenzel. 2011. “Ethnic Context and Immigration Policy Preferences among Latinos and Anglos.” Social Science Quarterly 92: 1-19.


