In the wake of the 2012 election, there has been a good deal of hand-wringing among Republicans in response to their party’s dismal showing among Latinos. In no state was this more evident than in Nevada. Despite the economic downturn of the last five years, which hit Nevada’s Latino community particularly hard, data from the impreMedia/Latino Decisions Election Eve Poll indicates that President Obama was supported by 80% of the Latino electorate.[1] In contrast, his Republican opponent, Mitt Romney, took just 17% of the Latino vote. Moreover, exit polling data suggests that Latinos accounted for 18% of the total vote; an increase of over 3% from 2008 and a turnout level that is nearly commensurate with the age eligible Latino voting population in the state. Not surprisingly, President Obama easily carried Nevada.
In this post, I pair analysis of the Election Eve Poll with post-election actions by Nevada Republicans to assess the GOP’s prospect of improving its standing with the state’s Latino community. I begin by summarizing demographic variation in Obama and Romney’s support. Next, I assess the level of consistency between the Republican’s policy agenda and the preferences of Nevada Latinos. I conclude by examining how Republican elected officials in Nevada have responded to the state’s Latino community in light of the 2012 election.
The Demographics of Obama’s Latino Support
The data summarized in Figures 1 through 4 suggest that support for President Obama among Nevada’s Latinos was as deep as it was wide. Specifically, the figures summarize Obama and Romney’s share of the vote broken-down by gender (Figure 1), income (Figure 2), education (Figure 3), and age (Figure 4). Across every sub-category, Obama won comfortably. Of particular note is the near equivalent support of Obama among male and female Latinos. Whereas the June and September Latino Decisions’ battleground poll for Nevada suggested a small gender gap, this did not come to fruition in November.
Figure 1
Gender Variation in the Presidential Vote among Nevada Latinos
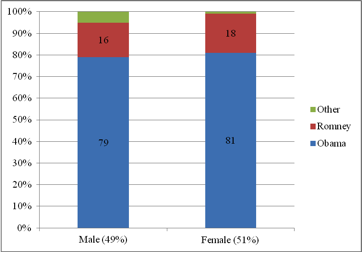
Figure 2
Income Variation in the Presidential Vote among Nevada Latinos
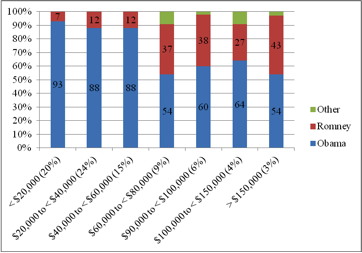
Figure 3
Educational Variation in the Presidential Vote among Nevada Latinos
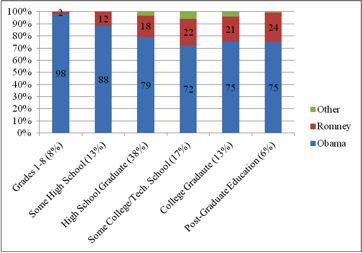
Figure 4
Age Variation in the Presidential Vote among Nevada Latinos
The vote distributions for income and education presented in Figures 2 and 3 highlight the President’s overwhelming support among lower income and less educated Latinos. In a prior post (“Nevada’s Odd Numbers: The Complexity of Polling in the Silver State”), I examined how the exclusion of a proportionate number of lower socio-economic Latinos from pre-election polls conducted in the state underestimated Obama’s support in the Latino community; a point borne out by these data. Perhaps the one bit of good news for the Republicans can be found in Figure 3.[2] While Obama won every income category, his margin decreased among those with family incomes greater than $60,000. Unfortunately for the Republicans, just over 20% of Nevada Latinos who voted in 2012 had household incomes above that level. Romney’s vote share also increased slightly among the 36% of the Latino electorate with some level of education beyond high school.
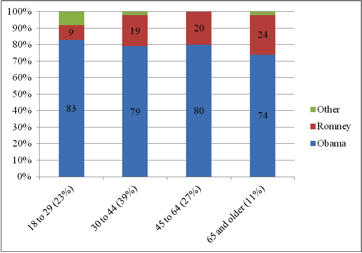
Lastly, Figure 4 suggests troubling long term prospects for the Republican Party. Latinos who are 29 years old or younger were the least likely to support Romney. Moreover, not only did this cohort constitute nearly a quarter of the Latino electorate, these voters are over nine times as likely to identify themselves as Democrats as opposed to Republicans. The patterns are even more lopsided for first time voters, who accounted for 40% of the 2012 Latino turnout in Nevada. These voters supported President Obama at a 90% clip and were more than eleven times more likely to self-identify as Democrats as opposed to Republicans.
Is it a Romney problem or a Republican problem?
In light of these patterns, Republicans might be tempted to blame the party’s poor showing among Latinos on Mitt Romney’s decision to run to the right on immigration related issues during the Republican nomination campaign. To be sure, Romney’s campaign did more to repel Latinos than attract them. Evidence for this claim can be gleaned from Figures 5 and 6. Specifically, the data presented in Figure 5 summarizing the degree to which Obama and Romney were perceived as caring about the Latino community indicates that nearly four out of five Latino voters in Nevada saw Romney as either uncaring or hostile to the Latino community. Just 12% responded that Romney truly cared about the Latino community. In contrast, 68% of voters perceived Obama as caring, with 18% responding that the President did not care too much, and only 6% felt that Obama was hostile.
Figure 5
Perceptions of Obama and Romney’s Attitudes towards the Latino Community
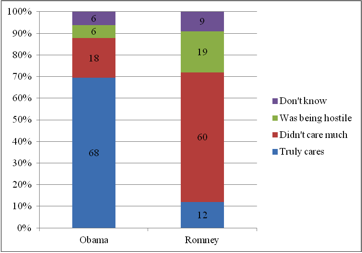
Figure 6
Impact of Immigration Related Issues on Enthusiasm for Obama and Romney among Nevada Latino Voters
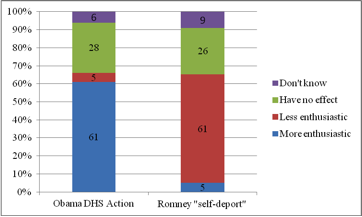
Some of this variation likely stemmed from how the candidates addressed immigration related issues during the campaign. Figure 6 summarizes the responses to two questions relevant to this point.[3] The first asks if Obama’s decision in June to stop the Department of Homeland Security (DHS) from deporting undocumented youth who attend college or serve in the military and provide them with a renewable work permit made respondents more or less enthusiastic about Obama. The second assesses if Romney’s statement that immigrants who cannot legally work in the United State should “self-deport” affected voters’ enthusiasm for Romney. Consistent with the findings of the June and September poll, Obama’s DHS action was quite popular among Latino voters as 61% of the sample indicated that the decision made them more enthusiastic about Obama. In contrast, the same share of respondents suggested that Romney’s advocacy for “self-deportation” made them less enthusiastic about his candidacy.
Figure 7
Preferences for Deficit Reduction among Nevada Latino Voters
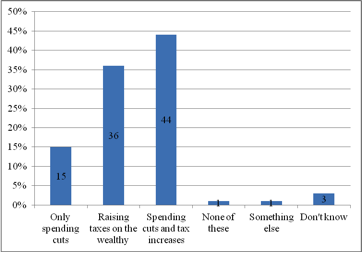
Figure 8
Support for Repealing “Obamacare” among Nevada Latino Voters
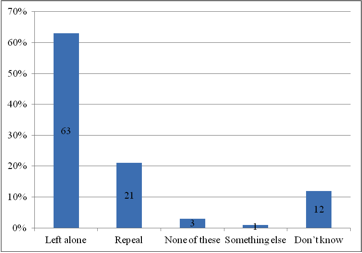
Figure 9
Role of Government in Ensuring Access to Health Care among Nevada Latino Voters
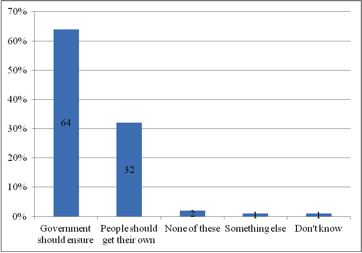
So while Romney did himself no favors among Latino voters in Nevada, there is also ample evidence that the Republican Party is out of step with the preference of the Latino community. Figures 7, 8, and 9 summarize respectively Nevada Latinos’ preferences for deficit reduction, repealing the Patient Protection and Affordable Care Act (e.g., “Obamacare”), and the role of government in providing access to health care. For all three policies, the vast majority of Nevada Latinos hold attitudes that are inconsistent with the policies advocated by the Republican Party. In terms of deficit reduction (see Figure 7), just 15% support a solution that relies exclusively on spending cuts, while 36% favor closing the deficit by raising tax on the wealthy and 44% prefer a combination of spending cuts and tax increases; the position Obama advocated during the campaign. President Obama’s signature, first-term legislative accomplishment, the Patient Protection and Affordable Care Act, is overwhelmingly popular among Nevada Latinos as 63% of respondents want the law left as is and only 12% favor its’ repeal (see Figure 8). Also, as is suggested by Figure 9, twice as many Nevada Latinos support a role for the federal government in ensuring universal access to health insurance as compared to making individuals responsible for getting their own health insurance.
Figure 10
Perceptions of the Most Important Problem Facing the Latino Community among Nevada Latino Voters
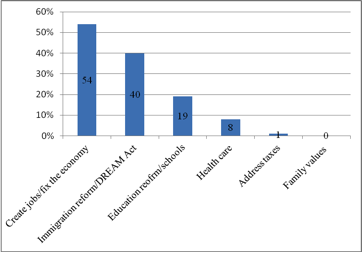
More generally, a common Republican talking point throughout the 2012 election cycle was that Latinos are a “natural” consistency for the GOP given the party’s economic messages and its family values agenda (i.e., opposition to abortion and gay marriage). At least in Nevada, there is little empirical evidence supporting such conjectures. Figure 10 above summarizes the responses to an open-ended question assessing the issues that Latino voters thought were the most important for their community. Not surprisingly, economic issues and job creation were the primary concern of Latino voters, followed by immigration reform and passage of the DREAM Act, and improving education, with health care a distant fourth. Among voters who identified the economy and jobs as the most important issue, over 77% voted for Obama. Obama’s vote share increased to 87% for those who identified immigration and passage of the DREAM Act as the Latino community’s most important issue and 92% for voters concerned about education and schools. Also note how little resonance that family values (1%) and taxes (0%) have as political issues for Nevada Latinos.
Responding to Nevada’s Latino Community
From the above analysis, three conclusions can be drawn. First, within Nevada’s Latino community there are few if any sub-populations where the Republican Party has a foothold. Two, the GOP’s policy agenda is inconsistent with the preferences of most Latino voters in the state. Third, Mitt Romney’s campaign made a bad situation worse.
This, however, does not mean that Nevada Latinos are monolithically Democratic voters. One of the most interesting findings of the Election Eve Poll is that while 40% of Latino voters in Nevada indicated that they were motivated to turnout to support Democrats (13% voted to support the Republicans), a near equal share (39%) responded that they voted to support the Latino community. Thus, the degree to which partisan and community identification diverge presents an opening for Republicans.
Nationally, the most obvious action that the GOP can take to build goodwill would be to play a constructive role in the passage of comprehensive immigration reform that includes a pathway to citizenship for undocumented immigrants. If this were done, a third of Nevada Latinos indicated that they would be more likely to vote Republican in the future. Specific to Nevada, there has been a shift in tone from at least one Republican, newly elected US Senator Dean Heller who narrowly defeated former House member Shelley Berkley in November. In his prior incarnation, Heller fancied himself as a rock-ribbed conservative who co-sponsored legislation to make English the country’s official language, supported amending Section 1 of the 14th Amendment to end “birthright citizenship,” and opposed the DREAM Act and President Obama’s DHS directive declaring that “I don’t support amnesty.” As part of his latest rebranding effort, Heller now presents himself as “very pragmatic” and speaks about the need for inclusion and a “more humanitarian approach” on immigration.
But where Nevada Republicans can make a real impact is at the state level, particularly in terms of addressing Nevada’s dysfunctional and under-performing education system. Yet, despite this opening, the GOP efforts are underwhelming. Republican Governor Brian Sandoval recently released his two year budget that includes two provisions that would benefit the state’s Latino community. The first expands all-day kindergarten to 46 additional at risk schools and the second allocates $14 million dollars for the biennium for English Language Learning (ELL).
While these are steps in the right direction, if the first of these proposals were implemented, it would further exacerbate inequities across the state. Specifically, there would continue to be three classes of schools in the state: those where the state pays the cost for all-day kindergarten, those where parents are required to pay roughly $3,000 for their children to attend all-day kindergarten, and those where all-day kindergarten is not offered. With respect to the ELL allocation, if the entire appropriation were directed to the Clark County School District (CCSD) it would equate to $140 for each qualifying student. Also, the Governor’s budget does not include any funds to coordinate teacher training to ensure consistent quality in the state’s ELL program or financial incentives to encourage the state’s best teachers to take on the extra demands of teaching in ELL classrooms.
More troubling, the Governor’s budget continues to use a K-12 funding formula (the Nevada Plan) that was developed in the 1960s and that appropriates the least amount of state funding on a per student basis to CCSD, which serves a population that is 70% nonwhite. In contrast, rural, predominately white school districts receive state appropriations that are, in some instance, two or three times larger on a per student basis. In addition to reinforcing geographic disparities, the Nevada Plan does not fund at-risk students, English language learners, or gifted and talented students; making Nevada one of just two states not to do so.
In an effort to address these historical inequities, in 2011 the Nevada Legislature commissioned a consultant to evaluate the state’s current method for funding public schools and suggest possible changes. As the consultant’s report makes clear:
The current formula is an elegantly designed funding mechanism suitable for an essentially homogeneous rural state. This makes sense in view of the population base and demographic characteristics of Nevada in 1967 when the Nevada Plan was implemented. However, the Nevada of the 1960s and 1970s is not the Nevada of today. Nevada is a diverse state in terms of types of schools (from one room school houses to 3,000‐plus comprehensive high schools), types of pupils (the largest school district is now majority‐minority), and languages spoken (approximately 145 different languages) – see page 20 of this study.
While the Democrats who control the Nevada Legislature have indicated that significantly revising how the state funds K-12 education is their top priority, a recent story appearing in the Las Vegas Sun reported that the “governor has no appetite to engage in the funding equity fight this session.”
David F. Damore is an Associate Professor of Political Science at the University of Nevada, Las Vegas and an expert in Nevada politics.
The commentary of this article reflects the views of the author and do not necessarily reflect the views of Latino Decisions. Latino Decisions and Pacific Market Research, LLC make no representations about the accuracy of the content of the article
[1] The sample consisted of 400 registered Latino voters who either voted early or responded that they were certain to vote. The poll’s margin of error is 4.9%.
[2] Note that 20% of the sample either did not know or refused to report their household income.
[3] Note that for these questions, the sample was split in half so that 200 respondents were asked the Obama DHS question and 200 respondents were asked the Romney “self-deport” question.

