The pre-election analysis of polls by Nate Silver at 538 proved accurate in predicting 34 of 37 elections for the U.S. Senate. The three states that were off were Alaska, Colorado, and Nevada. Among these, Nevada was the biggest upset with the average pre-election polls showing Harry Reid trailing by 3 points, and the final vote tally showed him winning by 5 points. As part of the effort to better understand this error, we at Latino Decisions pointed Silver to the inconsistent and often error-prone methodology in which pre-election surveys do not accurately interview or account for the Latino electorate. In Nevada, getting the Latino vote “right” is crucial to the overall state estimates, as Latinos account for roughly 12% of all voters in the Silver State.
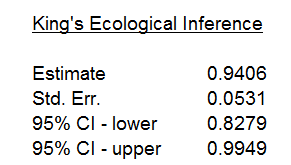
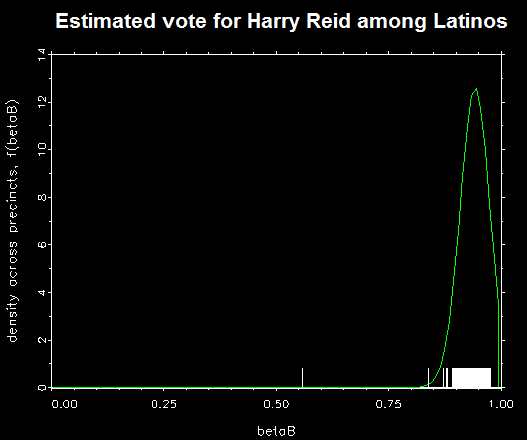
Not only were the pre-election polls wrong, but as we have already pointed out, the national exit poll estimate for Latinos is extremely unreliable. Using actual vote results from the state of Nevada, Harry Reid is estimated to have won 94% of the Latino vote (more on this below, keep reading to see the data and charts).
While the NEP has not yet made it’s data available for public inspection, we now have growing evidence from official statements of the vote, that discredit the datapoints in the NEP for Latinos. For the state of the Nevada, the exit polls indicated that Harry Reid won an estimated 68% of the Latino vote, compared to 30% for Sharron Angle. If true, this would represent an 8-point improvement for the Republican over the estimated 22% of the Latino vote won by John McCain in Nevada in 2008. Recall that McCain courted the Latino vote through positive outreach, had previously co-authored a comprehensive immigration reform bill, and called for an end to the scapegoating and harsh rhetoric towards immigrants by those in his own party. This resulted in 22% of the Latino vote in 2008. In contrast, a central feature of Angle’s campaign was emphasizing her strict policies on illegal immigration, which ultimately resulted in her campaign being called anti-immigrant, anti-Latino, and outright racist. In Nevada, 55% of Latino voters are naturalized citizens, and 31% are U.S. born, but have immigrant parents. In the final weeks of the campaign, Angle aired the immigration-themed ad, “the wave” in which she told Nevadans that immigrants come to the U.S. to join violent gangs, and cause White families to live in fear. It is unlikely that this message went over well for the 86% of Latino voters who are either immigrants, or the children of immigrants (nor was it likely to impress the 10% who’s grandma and grandpa immigrated to America). On the issue of immigration, Angle drew a line in the sand. While Harry Reid was on the side of immigrants, Sharron Angle was not. She strongly opposed the DREAM Act, which Reid promoted, and our poll of Latino voters in Nevada found that 89% agreed it was important for the Congress and President to act swiftly to pass the act. Thus, it came as an utter shock to us that the exit polls reported Angle winning 30% of the Latino vote in 2010. How is it even possible that the media did not stop and scratch their head when they saw this figure?
Beyond being extremely unlikely that Angle won 30% of the Latino vote, to Reid’s 68%, it is mathematically impossible. For starters, using the NEP’s own data, the estimates for vote share by subgroup do not add up to the real election results. The actual election results show Reid winning by 5.7 points. If we take the exit poll results by subgroup, and multiply them by the share of the electorate for each group, the result is a final advantage for Reid of 47.6% to 44.1%, a margin of 3.5. However, if we substitute the Latino Decisions election poll numbers of 90% for Reid to 8% for Angle, the polls predict a much closer result to the actual vote outcome.
The second, and much more convincing piece of evidence that corroborates the Latino Decisions election poll is the official statement of votes cast released on November 10, 2010. The SOV includes precinct-by-precinct vote results, and through a combination of U.S. census population data, and Spanish-surname voter registration matching, it is possible to provide very accurate estimates on the number of Latino voters in each precinct. Researchers can them employ a technique called ecological inference to generate very precise point estimates of the share of the Latino vote won by a given candidate. This technique, fine-tuned by Harvard political science professor, and statistical guru, Dr. Gary King, is widely accepted as a legal process by which courts adjudicate voting rights lawsuits under the 1965 Voting Rights Act. Given the strength of this statistical technique in estimating the true vote share, and its acceptance by political science and legal scholars, we are quite confident in the point estimates produced by King’s ecological inference (more here).
We obtained the precinct-by-precinct vote results for Clark (here) and Washoe (here) counties Nevada, which are readily available on each county website. Among all Latino voters in Nevada, 72% reside in Clark County, and 23% reside in Washoe county, thus these two counties essentially account for the entire Latino electorate. For the 1,402 voting precincts which we obtained usable data in Clark and Washoe counties, Nevada, ecological inference estimates 94% of Latinos voted for Harry Reid.


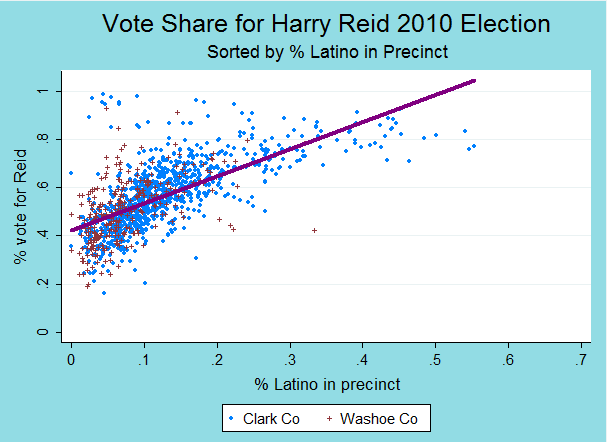
Indeed, the pairwise correlation between percent Latino and percent Reid in these two counties is a very robust .5145. In a simple regression analysis (called Goodman’s ecological regression), the resulting coefficient for “percent Latino” reveals an almost perfect 1-to-1 relationship exists between percent Latino in the precinct and percent for Reid in the precinct (coefficient = 1.053; standard error = .0507; t-value=20.76). That is, the regression predicts that as the percent Latino increases by 1 point, the vote share for Harry Reid also increases by 1 point. The logical conclusion is that if a precinct were to consist of 100% Latino voters, Harry Reid would be expected to have won 100% of the vote in such a precinct. A graphical display of this relationship can be found in the figure below, which depicts the percent Latino in each precinct (along the bottom x-axis) as well as the percent won by Reid in each precinct (along the left-handed y-axis), and each dot represents each individual precinct. The purple line superimposed on top is the regression fit. What is plainly clear is that the real data prove Sharron Angle did not win 30% of the Latino in 2010, she won less than 10% without a scientific doubt.


